What Is a PCB? A Comprehensive Guide to Printed Circuit Boards
A PCB (Printed Circuit Board) is the foundation of modern electronics, providing mechanical support
In a high-mix PCBA environment — running 30 to 80 distinct assemblies per month across varying stencil apertures, paste volumes, and component densities — the first board after a changeover is statistically the most dangerous board you will produce that shift. The reason is systemic, not accidental. Every changeover introduces compounding variables: a new stencil with different aperture geometry, a paste deposit specification calibrated to a different component land pattern, and ambient temperature and humidity conditions that have drifted since the last run.
Traditional 2D SPI measures deposit area and presence. It cannot measure paste volume. So when a 0402 resistor land is under-pasted by 22% in height, 2D SPI reports green — and the defect waits patiently to manifest as a cold joint or tombstone after reflow. This is not a fringe scenario. In our production data across industrial motor control boards, medical device assemblies, and multi-layer embedded computing platforms, paste volume deviation at changeover is the root cause in over 60% of first-pass yield failures traced back to the printing stage. The defect is born at print; it dies — expensively — at ICT or functional test.
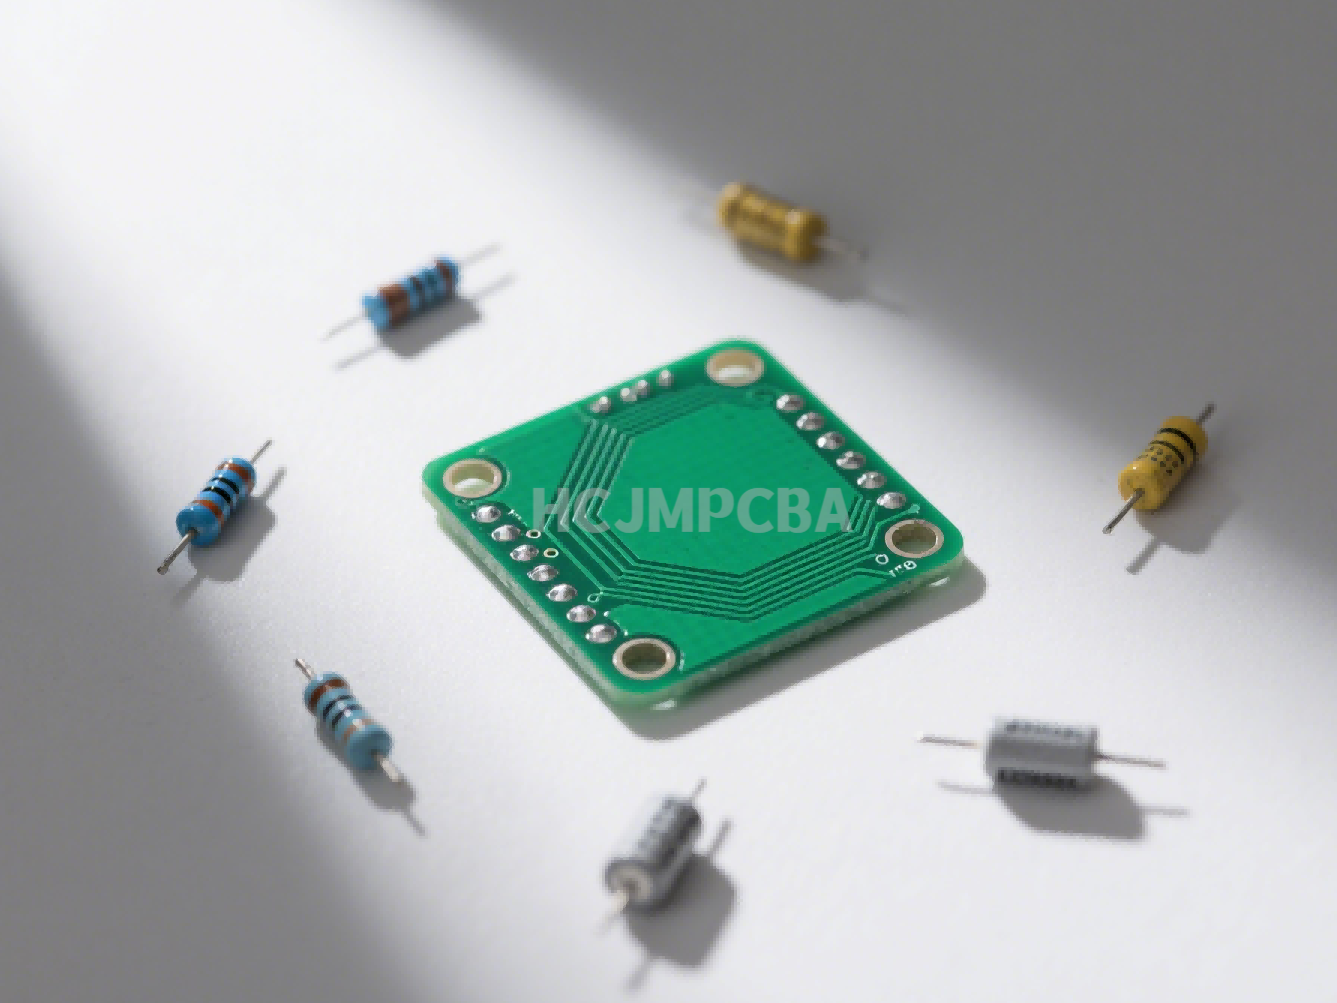
At Guangzhou Huachuang Precision Technology Co., Ltd. (HCJMPCBA), we operate 3D SPI closed-loop systems integrated across our multiple high-speed SMT lines. With nearly 2,500 m² of ESD‑protected manufacturing space and IATF 16949‑certified quality management, we have built our process discipline around eliminating paste variability at its source — not detecting it downstream.
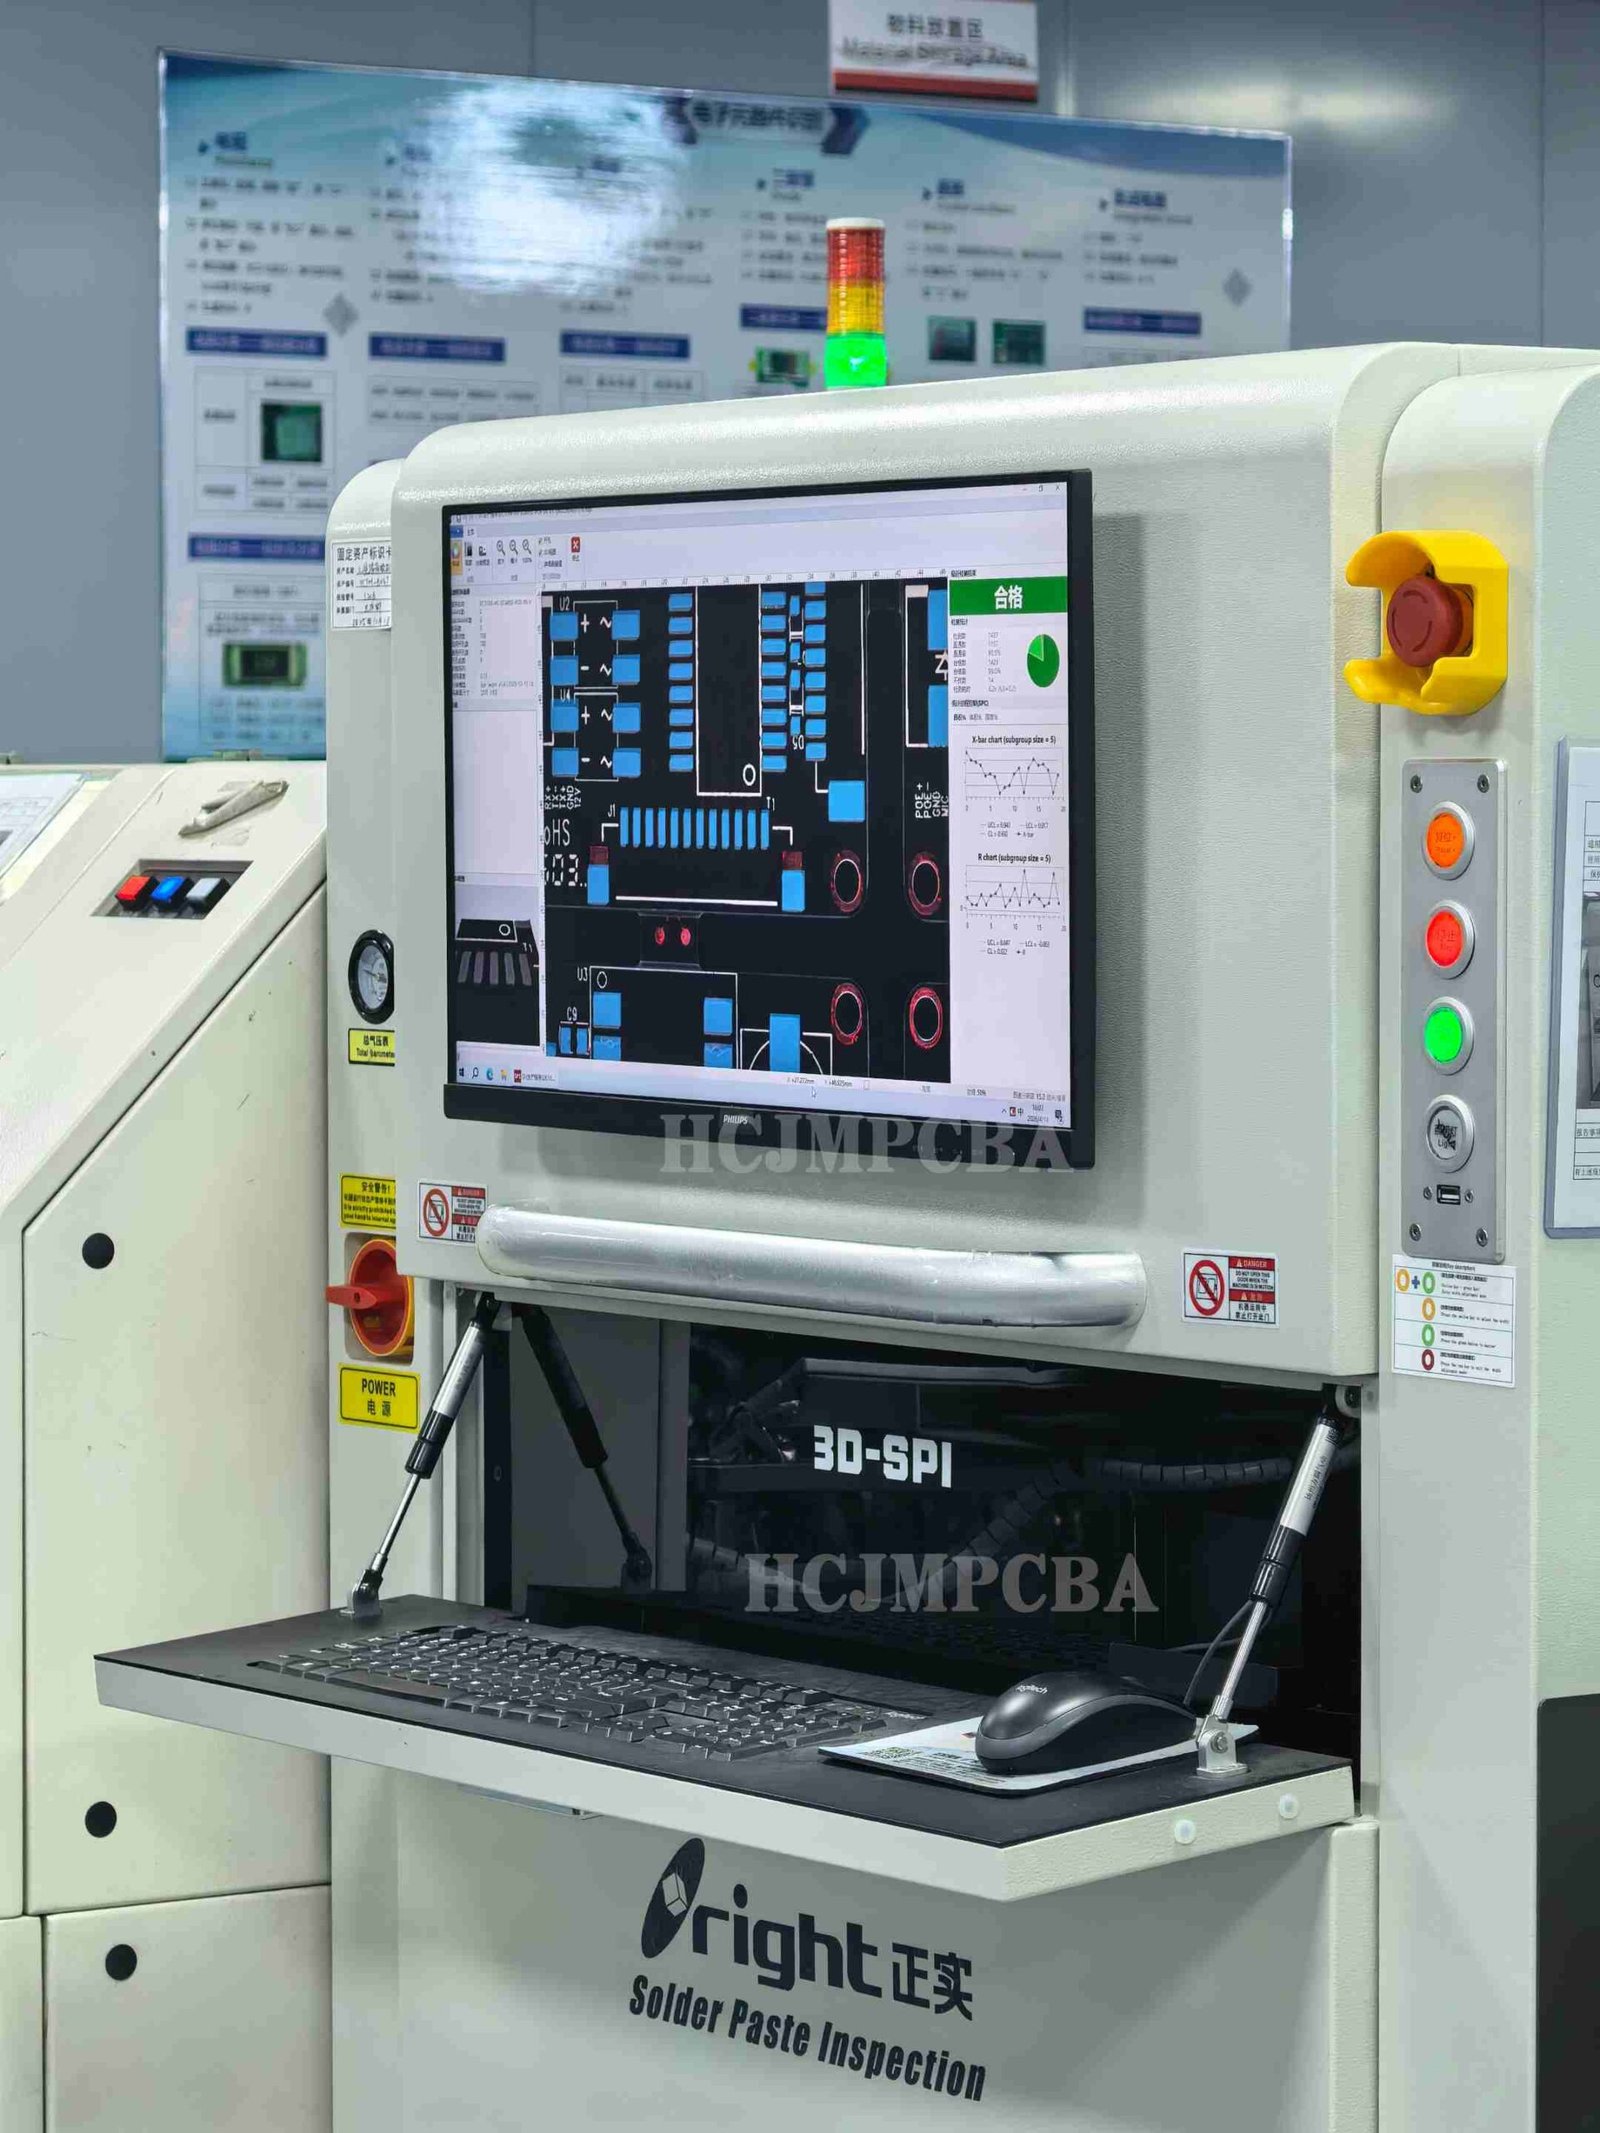
3d Spi Hcjmpcba
3D SPI closes the gap that 2D inspection cannot address, but the technology inside the machine determines whether it actually catches the problem. Two primary sensing technologies compete in the market: laser triangulation and structured light projection. For high-mix lines carrying 0.3 mm-pitch QFN, 01005 passives, and multi-row connectors on the same panel, the difference is not academic.
Laser triangulation achieves Z-axis resolution of approximately 1 μm; structured light projection operates at approximately 5 μm. On a 150 μm nominal paste deposit, a 5 μm measurement uncertainty alone represents ±3.3% intrinsic error — before any real process variation is counted. For fine-pitch deposits where the IPC‑7525 aperture-area ratio already constrains paste release to tight tolerances, that error margin is the difference between a valid measurement and a meaningless one. Structured light systems offer speed advantages suited to high-volume, standard-pitch production. In high-mix environments carrying fine-pitch BGAs and sub‑0.4 mm components across diverse board populations, 1 μm Z‑axis resolution is the appropriate specification floor.
Our 3D SPI systems operate on this basis, capturing paste height, area, and computed volume for every deposit on every board, generating a real‑time Cpk for paste volume distribution across the panel. This granularity enables us to detect and correct volume deviations that would otherwise remain invisible until reflow.
3D SPI data becomes process control only when it feeds back into the printing process automatically. The closed‑loop architecture works as follows: SPI captures height, area, and volume per deposit, computes X/Y registration offset and volume deviation from nominal, transmits correction values to the printer’s servo axes, and applies adjusted squeegee pressure and speed parameters before the next board enters the machine. Correction is active on Board 2. The defect does not exist on Board 2.
In open‑loop operation — where an operator reviews SPI data, decides whether to intervene, and manually adjusts the printer — the average response lag in our production records spans 6 to 8 boards from first anomaly detection to confirmed correction. In a 10‑board prototype run, that means a realistic scenario where half the run is produced under out‑of‑spec paste conditions before a human intervention occurs. At production scale, it means scrap, rework labor, and escaped defects that reach functional test or the field.
The closed‑loop response is not faster because the equipment is faster. It is faster because the decision has been removed from the human response chain entirely. For our customers in industrial automation, medical devices, and semiconductor test equipment, this translates directly to predictable yield and reduced time‑to‑market — particularly important when scaling from prototype to volume production.
The closed‑loop architecture is necessary but not sufficient. The feedback loop must be validated after every changeover, because a new stencil introduces a new baseline that the system has not yet characterized. We apply a four‑point changeover acceptance protocol before releasing any new job to full production.
First, stencil qualification: aperture dimensions verified against Gerber data, stencil tension confirmed at ≥40 N/cm² across the print frame. Second, first‑article SPI pass across three consecutive boards: paste volume Cpk ≥ 1.33 on all deposit classes, with no single deposit below 70% or above 130% of nominal volume. Third, alarm threshold validation: upper and lower control limits confirmed active in SPI software, with any limit‑exceeded condition configured to halt the printer rather than log a passive warning. Fourth, paste condition verification: paste temperature logged at 23–25 °C, viscosity confirmed within supplier‑specified range for the current ambient humidity band.
The “first 10 boards scrapped” scenario — endemic in unstructured high‑mix environments — is not a production tax. It is a process failure. This protocol is the systematic prevention. At HCJMPCBA, we enforce this protocol on every job, whether it is a 50‑board prototype run or a 10,000‑board volume production order. Our engineering team provides on‑site DFM review and process setup support to ensure that every new assembly receives the same rigorous qualification, regardless of batch size.
Downstream AOI data becomes diagnostically actionable only when linked to upstream SPI data at the board and deposit level. The correlation our process records consistently confirm: paste volume below 75% of nominal on a component land increases tombstone and cold‑joint defect rate at downstream AOI by 3 to 5× for 0402 and smaller components. Paste volume above 130% of nominal on fine‑pitch IC lands increases bridging defect rate by 2 to 4×, depending on component pitch and reflow profile. This is causal, not coincidental.
When our 3D AOI flags a tombstone cluster on a specific component type, the first diagnostic step is to pull the SPI volume log for that board and that land pattern. In over 70% of cases, the AOI finding traces directly to a paste volume anomaly at print — often occurring immediately after a stencil clean cycle or an ambient humidity shift between shifts. This data loop — SPI volume at print, reflow, AOI defect code — closes the root cause cycle at the printing stage rather than the inspection stage. It eliminates the diagnostic ambiguity that costs engineering hours in manual defect triage and replaces post‑hoc analysis with upstream prevention.
Our intelligent MES system provides full component‑level traceability, linking SPI data, reflow profiles, and AOI results to individual boards. This enables our customers to receive not just assembled boards, but complete process documentation for every unit — critical for medical and automotive applications where traceability is non‑negotiable.
Engineers configuring 3D SPI for a high‑mix line should structure parameters around changeover risk rather than steady‑state production efficiency.
Set changeover confirmation at three consecutive boards minimum. Single‑board first‑article acceptance is statistically invalid — one board provides no population for Cpk calculation. Three boards is the minimum for a meaningful Cpk ≥ 1.33 confirmation.
Define alarm thresholds as hard stops, not soft warnings. Volume deviation exceeding ±25% of nominal must halt the printer. Warning‑only configurations are consistently overridden by operators under schedule pressure — the data exists, the defect proceeds.
Use a rolling 20‑board statistical window for steady‑state SPC. Shorter windows are oversensitive to natural process variation; longer windows mask genuine drift. Twenty boards represents an appropriate balance for typical HMLV batch sizes.
Log ambient temperature and humidity per board alongside SPI data. Paste rheology shifts measurably above 60% RH and below 20 °C. SPI volume data without environmental context cannot distinguish process drift from equipment drift during root cause analysis.
Correlate per‑job SPI Cpk with downstream AOI defect rate on a closed feedback cycle. Jobs with first‑article Cpk between 1.33 and 1.67 should be flagged for enhanced AOI sensitivity settings on the first panel, preventing escapes during the statistical stabilization phase of a new assembly run.
These recommendations are not theoretical — they are the operating standards we apply across our production floor every day. For customers transitioning from prototype to volume production, we offer process engineering consultation to help establish similar discipline in their own supply chain.
High‑mix PCBA is won or lost at the printing stage. Downstream inspection detects; only upstream process control prevents. Our 3D SPI closed‑loop architecture, changeover acceptance protocol, and SPI–AOI data correlation framework are built into standard production practice under our IATF 16949‑certified quality system — providing the process control rigor and component‑level traceability that industrial automation, life sciences, and semiconductor test equipment programs require.
With production capacity supporting volumes from pilot runs of a few hundred boards to mass production of tens of thousands per month, HCJMPCBA delivers consistency at every scale. Our facility houses multiple high‑speed SMT lines, automated optical inspection (AOI), X‑ray inspection, and fully integrated MES systems — all calibrated to maintain the same process discipline whether we are running your first prototype or your ten‑thousandth production unit.
Our engineering team provides upfront DFM reviews, stencil design optimization, and process parameter recommendations before your first board enters production. We work closely with material suppliers to ensure paste and stencil compatibility, and we maintain transparent quality reporting with full traceability for procurement teams who need audit‑ready documentation.
Ready to see whether your current assembly design is optimized for high‑mix process control? Contact our process engineering team for a no‑obligation DFM review — our engineers will evaluate your Gerber data, BOM, and paste volume requirements before your first board enters production.
Guangzhou Huachuang Precision Technology Co., Ltd. (HCJMPCBA) – Your partner for high‑mix PCBA manufacturing with closed‑loop process control.
A PCB (Printed Circuit Board) is the foundation of modern electronics, providing mechanical support
Discover what a blank PCB and parts are—you'll learn about blank PCB board, bare printed circuit b
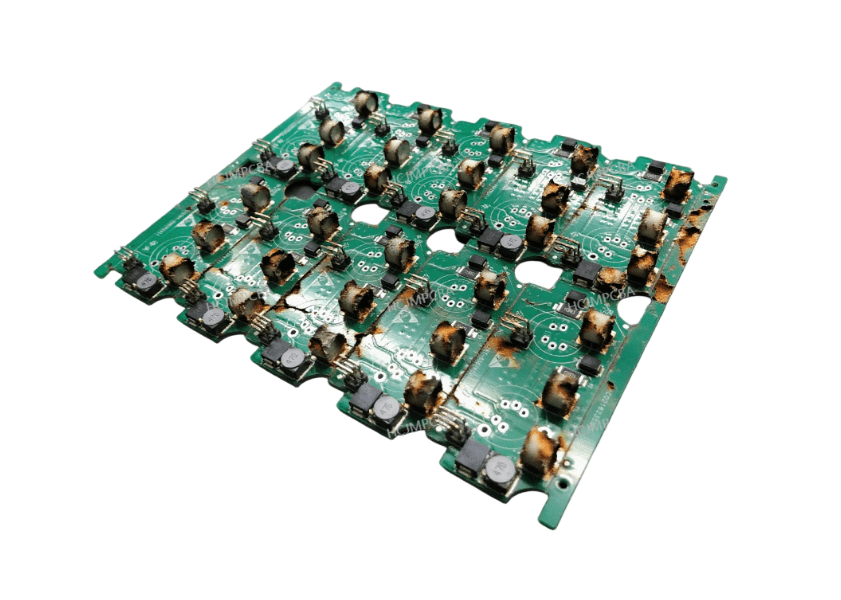
Explore what does most damage to pcb circuits, including burnt circuit board, burnt PCB trace, short